Updated: 20 June 2024
Aider’s Client Insights section provides you with key performance insights to help you deliver advisory services efficiently.
Contents:
Deliver advisory services efficiently with Aider's performance insights
Aider helps you...
- Filter out the noises in the raw figures.
- Focus on the significant trends (variances) and performance patterns.
- Spot trends and patterns more easily with graphs that even your clients can understand.
- Spot early signs of issues with Aider's Early Warning System estimates and forecasts
- Easily communicate timely and proactive insights with your clients via email.
- Easily create small-business friendly performance reports with Aider’s ‘Report Pack’ beta feature. Find out more >
What performance Insights are currently available
- Cash Flow
- Daily cash position and estimates for the current and next months
- Invoicing status for the last and current months
- Historical actual daily cash positions for the last 3 months
- Taxes & Compliance
- GST period completion (reconciliation status for the GST period) - next due + 2 prior periods
- GST forecast - next due + 3 prior periods + average over last 12 months
- Income Tax forecasts - current financial year vs last financial year
- Profitability - current financial year vs 3 prior financial years
- Revenue
- Direct Costs
- Gross Profit
- Operating Expenses
- Net Profit
Key features of Aider’s performance insights

- Category tabs:
- Related insights are grouped together to facilitate analysis and support your various advisory services.
- Alert counts you to the area(s) of the client’s business that requires attention due to significant negative trends.
- For all performance insights, there will be:
- A summary of the headline figures and trends related to that insight.
- If there are significant trends in these headline figures, they will be highlighted in red (negative trends) or green (positive trends).
- An interactive graph / chart to help you spot trends more easily (rather than by comparing raw figures).
- Hover over elements in the graph to see detailed figures.
- Click on the keys to hide and show the corresponding element in the graph – the graph will resize to show the remaining elements more clearly.
- Summary of the trends shown in the graph which offer more comprehensive details than the headline figures.
- A summary of the headline figures and trends related to that insight.
- Some insights have additional options and details such as:
- Period selector.
- Reconciliation status and alert affecting the insight’s reliability.
- This warns you if the insight's reliability may be affected by unreconciled transactions.
- Use the handy link to Xero Bank Accounts to fix the data problem.
- If you make a lot of changes in Xero and need to see updated insights immediately, click
 at the top, right under the client name to resync Aider with the latest Xero data. Otherwise Aider will update the insights overnight, ready for you the next day.
- Client settings used for the insight calculation.
- This helps you understand how the insight is calculated.
- You will then be able to make corrections if the wrong settings were used for the calculation.
- If you need help understanding an insight:
- Click on
next to the ‘Trends’ heading to get more details about the insight’s usage and benefits, data source, calculation and alerts logic.
- You can also click on the shortcut “How is this calculated >” to jump straight into the data source and calculation sections of the Insight Help Panel.
- Click on
- If you need more details about the underlying data:
- Many insights have handy links to the relevant sections in Xero, saving you time and hassle.
- Please note, once in Xero, you may need to change the period setting to see the matching period's data.
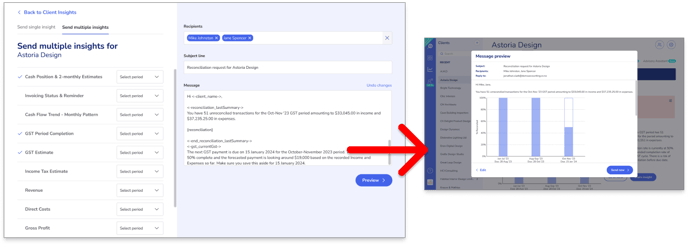
- If you would like to share the insights with your client:
- Simply click the ‘Share Insight’ button to share one or more insights via email.
- You can also share insights with your clients on a monthly or quarterly basis using Aider's Report Pack. Find out more >
- Simply click the ‘Share Insight’ button to share one or more insights via email.
