Updated: 24 February 2025
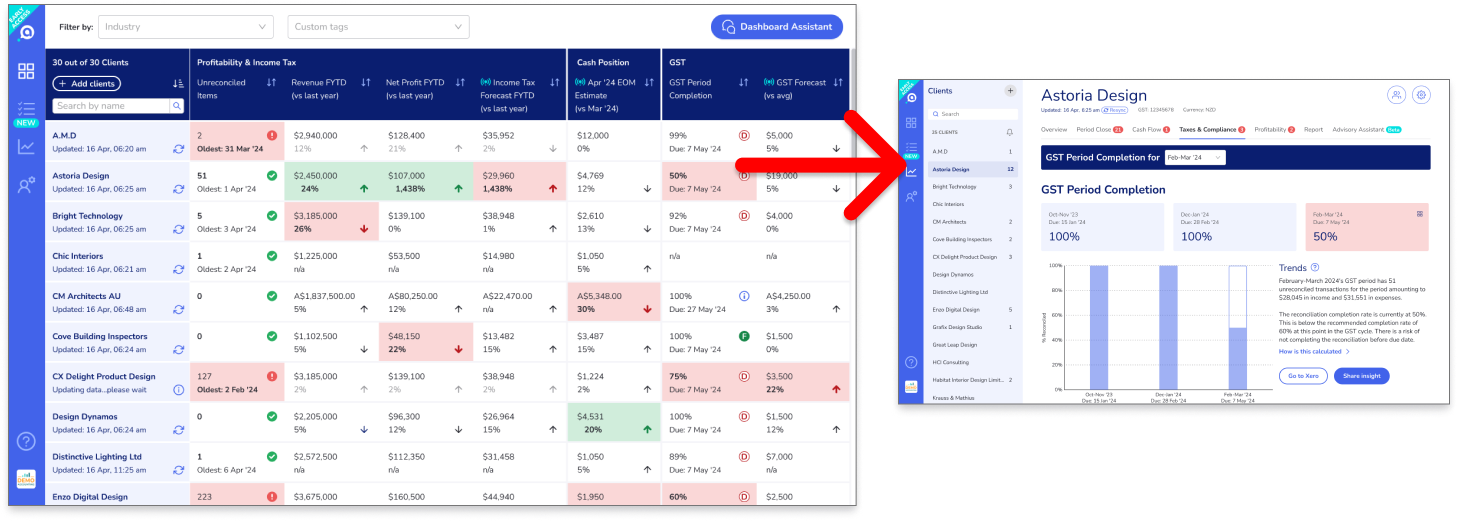
Your Advisory Dashboard shows you at a glance how ALL of your activated clients are performing on key metrics.
You can quickly:
- Identify who needs help without having to dive into each of your client's details individually
- Spot clients who may benefit from additional services - e.g. those who are growing and could benefit from financial advice to scale up their business sustainably
Use this to:
- Help you prioritize which clients to talk to at different points of the accounting calendar
- Identify opportunities to up-sell to your clients
How to use the Advisory Dashboard’s key features:
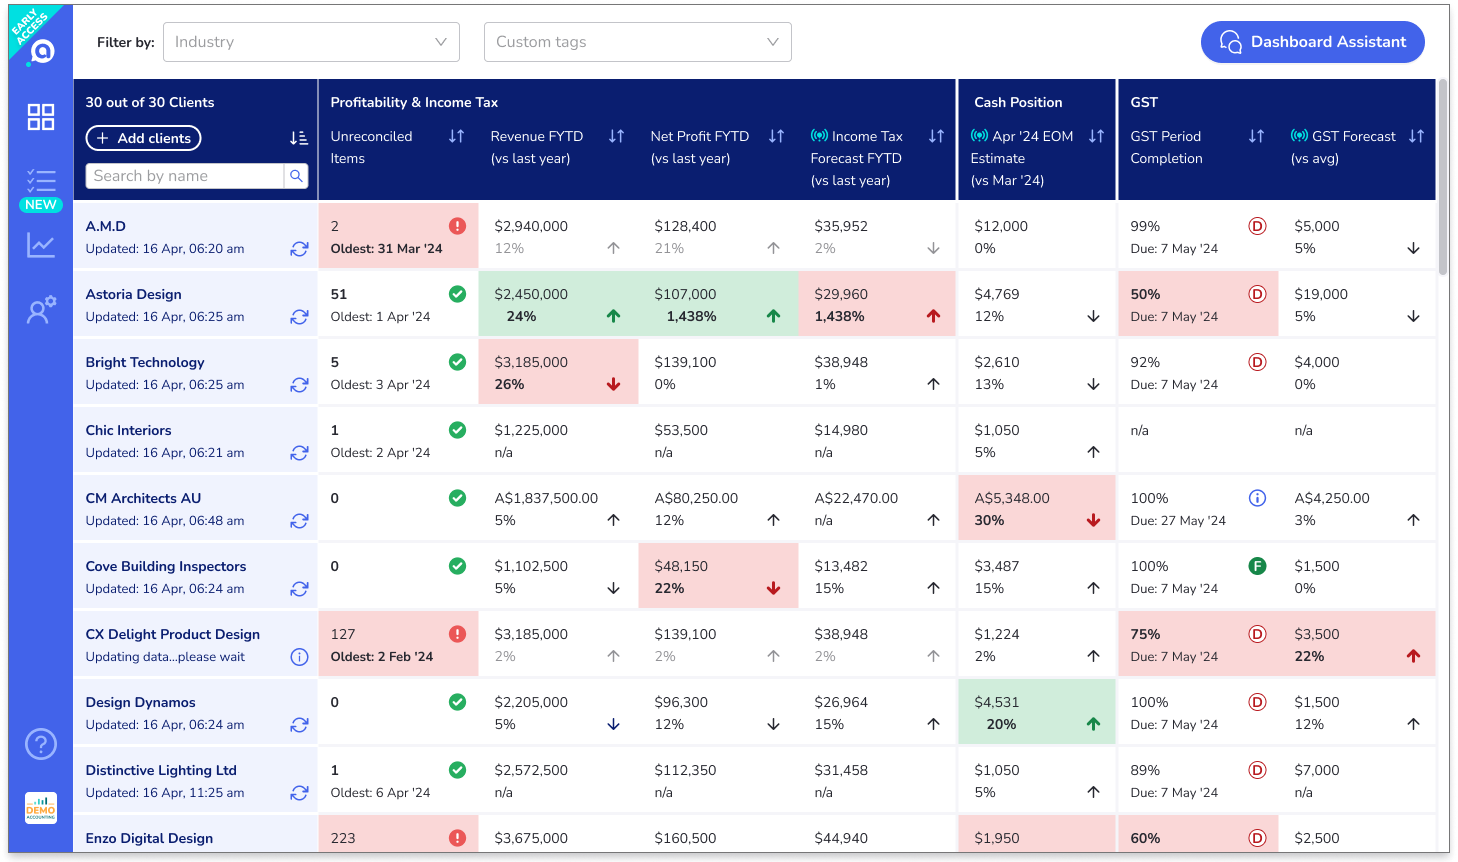
- For ease of analysis, the related key performance indicators (KPIs) are grouped together.
- Data dependencies such as reconciliation statuses are also shown with the KPIs that they affect.
- Prioritize fixing these data tasks first, so that the KPIs are more reliable.
- Aider automatically syncs with Xero daily overnight. But if you make a lot of changes in Xero and need to see updated KPIs immediately, click on
 under the client’s name to resync the data for that client.
- To help you manage by exceptions, significant trends are color-coded.
- Use this to help you quickly spot which clients need help and which may be open to additional services.
- Use this to help you quickly spot which clients need help and which may be open to additional services.
- To help you prioritize your jobs to be done, you can sort clients by KPI of interest:
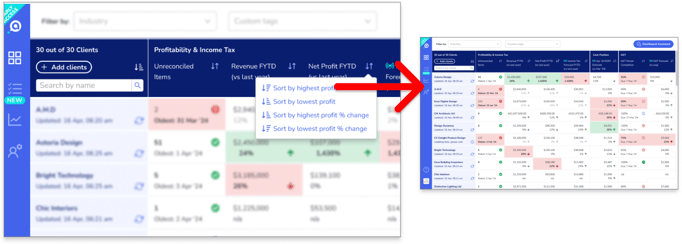
- Simply click on
 next to the column label.
 - Sort options vary by column. Most will allow you to sort by amount and by trend direction.
- You can also sort clients alphabetically and search for a client by name.
- Simply click on
- The Dashboard Assistant can also help you analyze & prioritise which clients to focus on:
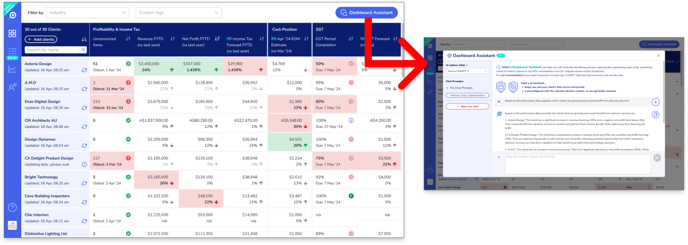
- Click the Dashboard Assistant button to access this time and effort saving tool.
- Use this AI-powered tool to identify advisory opportunities based on the data shown on the Dashboard and more.
- Learn more about Aider’s private and convenient Generative AI assistants >
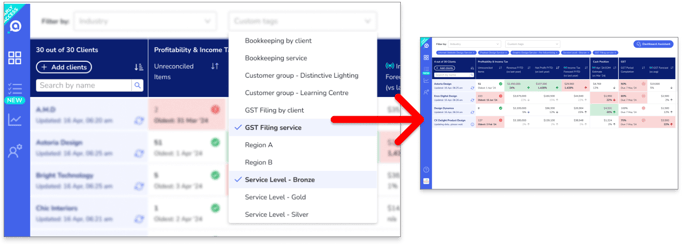
- To focus on specific client groups, filter your clients:
- Compare clients within an industry or related industries:
- Assess whether individual clients are doing worse than their peers, or whether there are industry trends impacting all clients in that industry.
- The industry classifications are taken from your clients’ Xero files. If any are incorrect, go to the client’s Xero Organization Settings > change and save their “line of business” field. Come back to Aider and click to resync Aider with Xero.
- Create and compare custom client groups:
- If you have different workflows for different client groups, you can use custom tags and filter to group clients accordingly.
- Simply go to the "Client Management" page, select the clients you want to tag and use the "Bulk Tagging" bar to add tags to the selected clients. You can tag clients by services, office or team assignment, or any other grouping necessary to support your processes. You can also add, edit, and delete tags for individual clients via their “Client Settings” page in the "Client Insights" section.
- You can then filter the Dashboard by custom tags to see only the group of clients you are interested in.
- Assess whether individual clients are doing worse than their peers, or whether there are trends impacting all clients in that custom group you defined.
- Compare clients within an industry or related industries:
- To find out more about a client’s KPI:
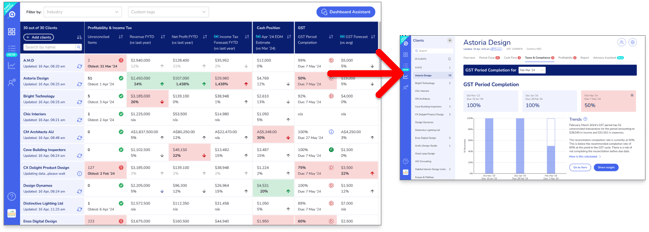
- Click the data cell to go to that client’s Client Insights pages.
- Click the data cell to go to that client’s Client Insights pages.
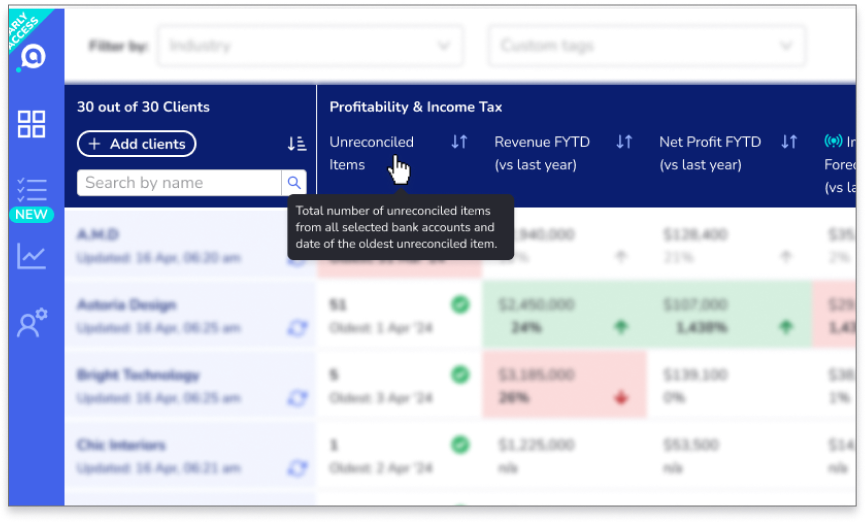
- To learn more about a KPI:
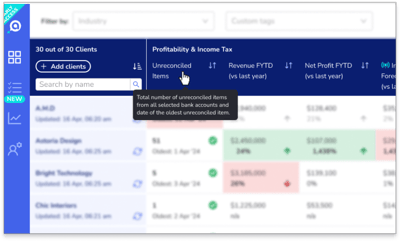
- Mouse-over the column label to get a short description.